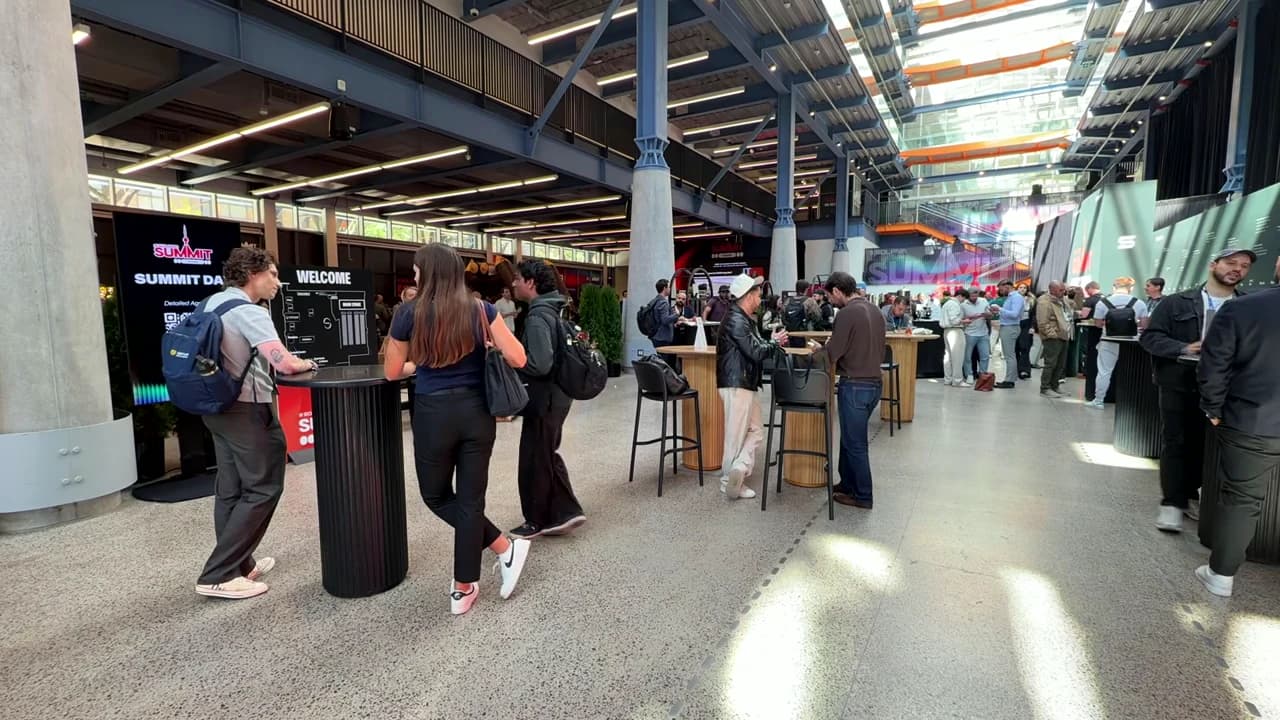
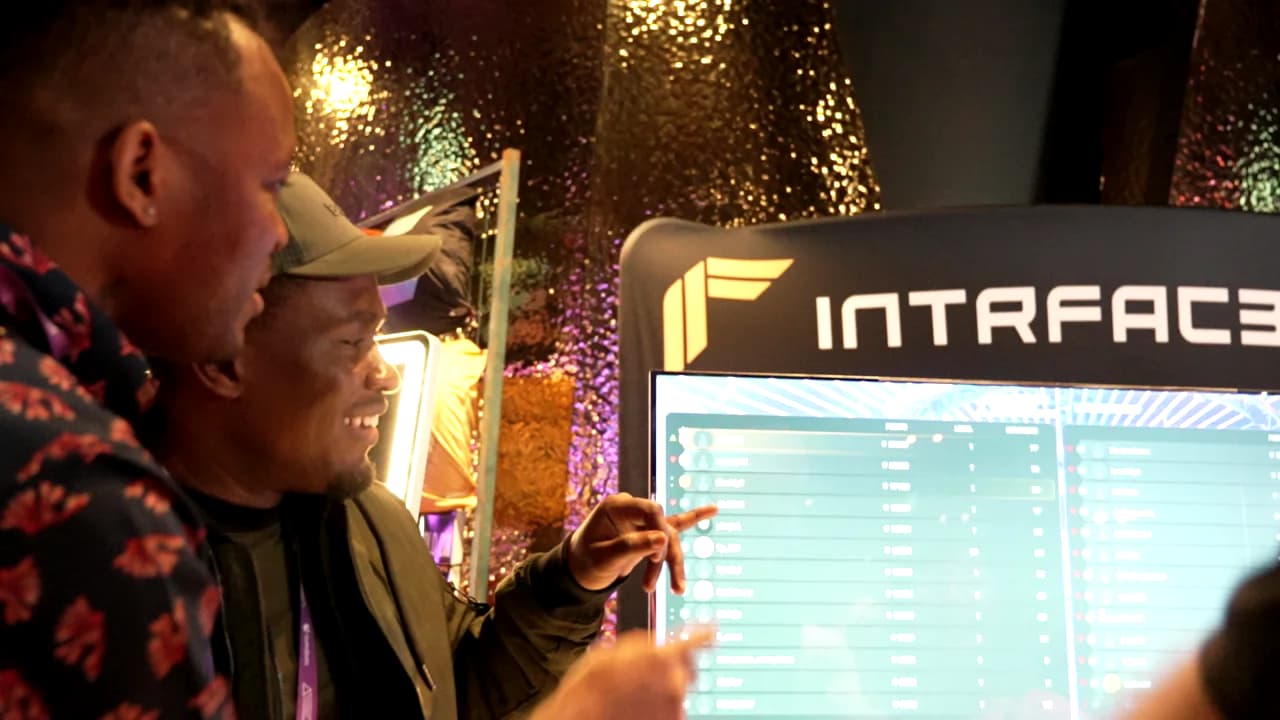
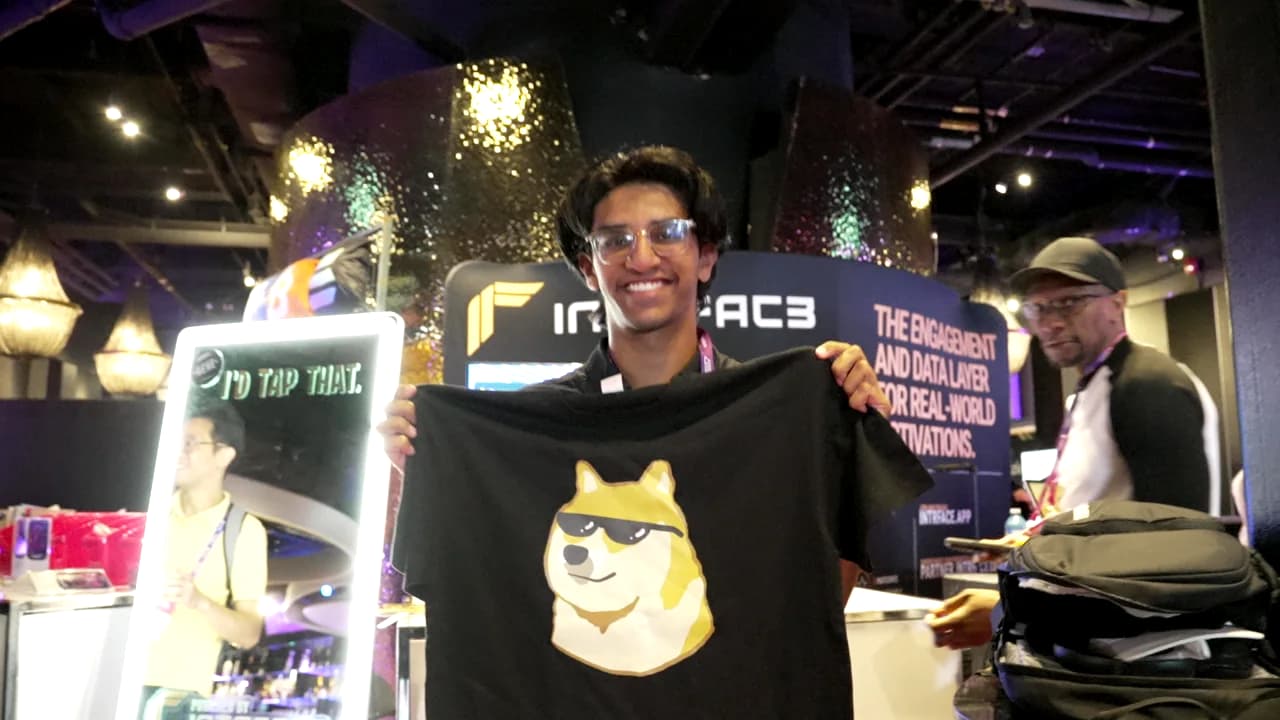
Explore live Intrface-powered events. Follow the journey from the show floor to the insights, outcomes, and lessons in the report.
Latest deployment · The full experience
The McLendon Experience 2026
A connected wristband and branded digital hub brought networking, discovery, sessions and competition into one experience. Explore the mechanics and the results behind them.
A seamless networking experience right on your wrist.
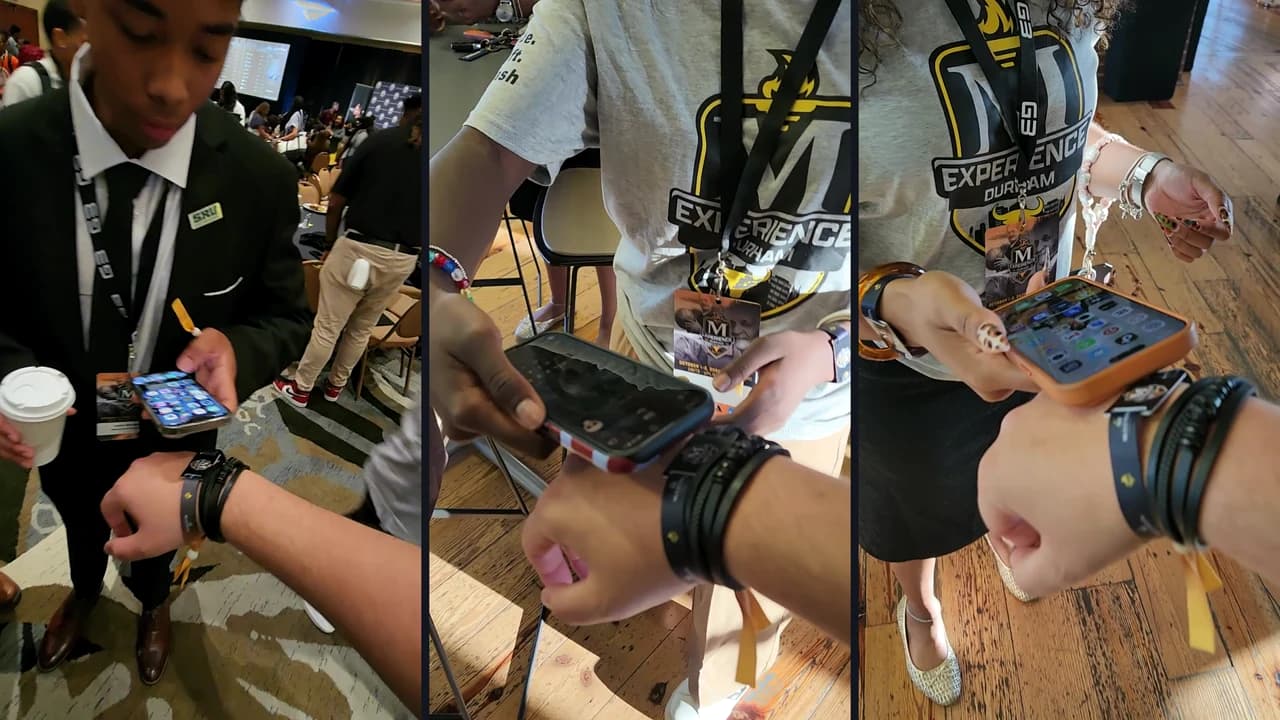
The McLendon Experience 2026 brought the physical event and the app together. A connected wristband opened a profile. A beacon gave people a reason to explore. Session codes, participation challenges, trivia and a live leaderboard made the program something attendees could actively engage with.
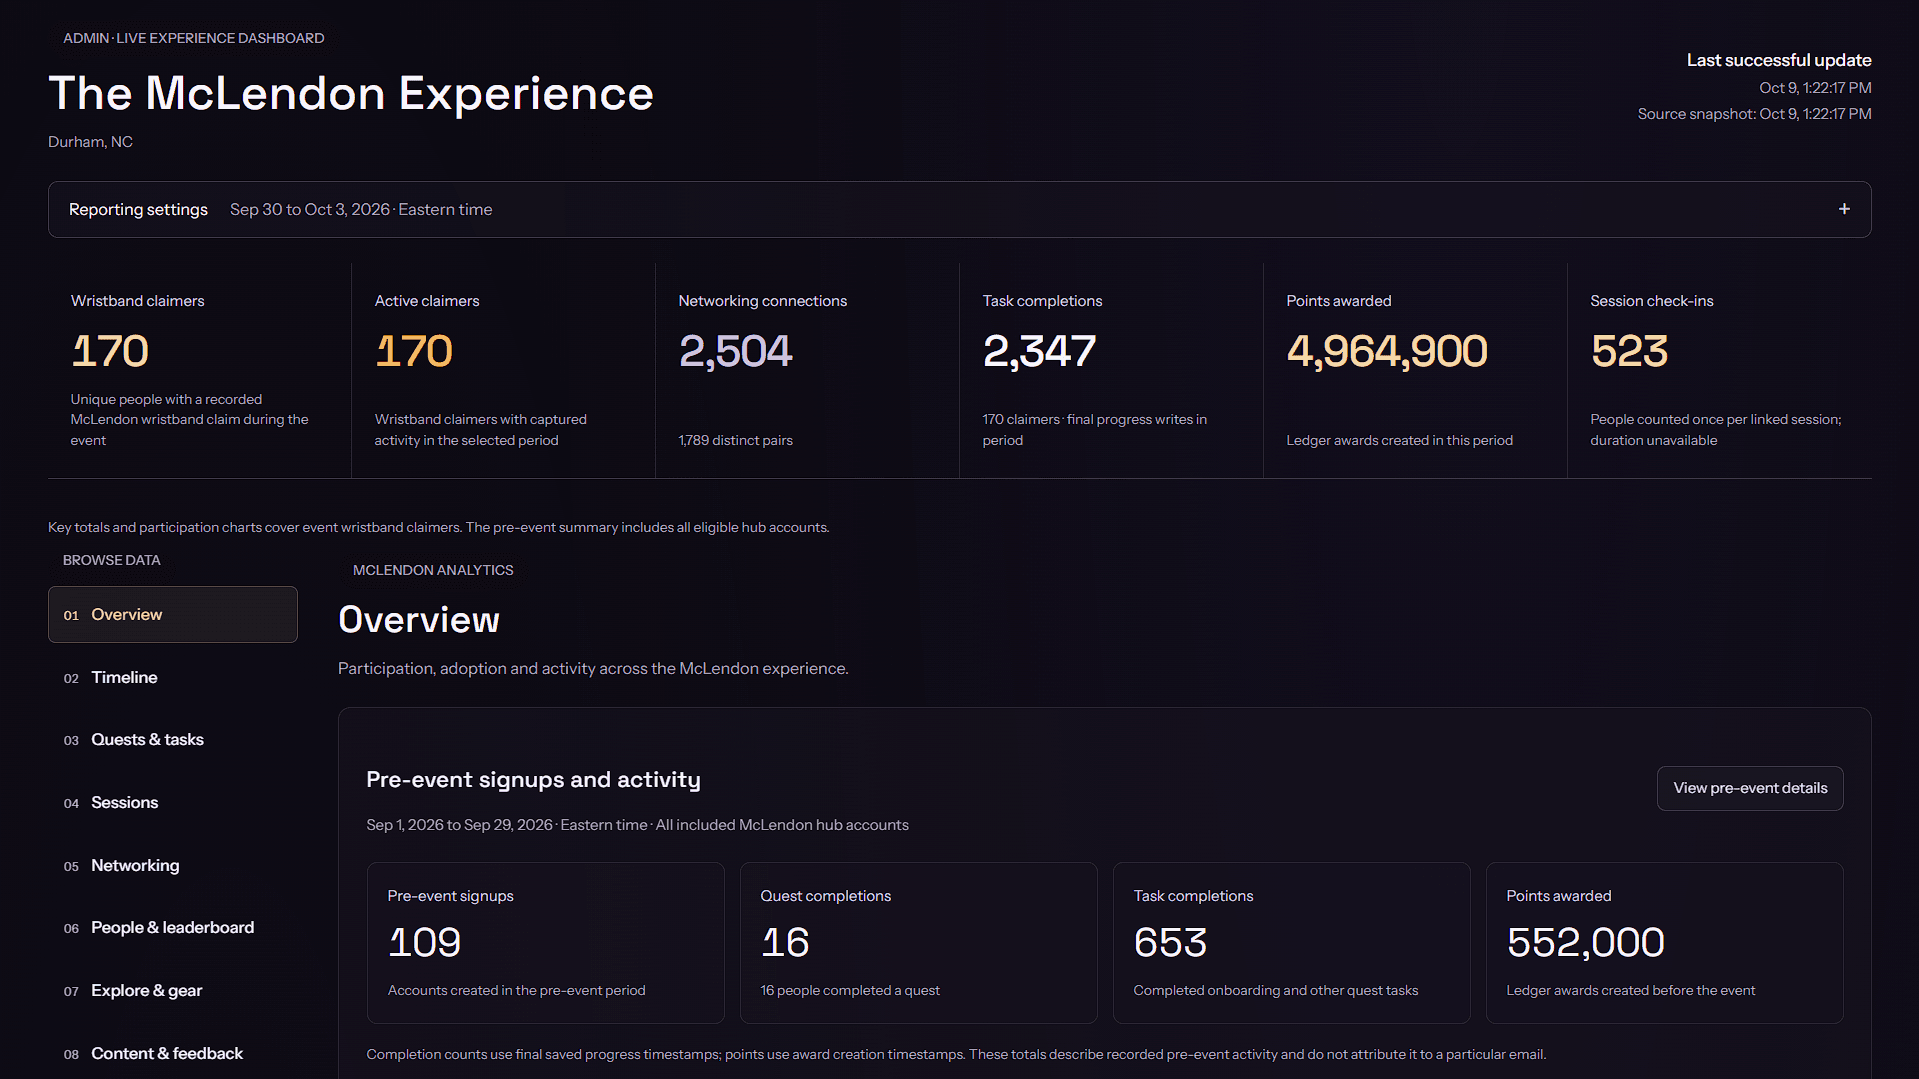
Across 170 people who claimed a wristband, the report recorded 2,347 completed tasks and 4,964,900 points awarded. The story starts before arrival and follows the mechanics that carried the experience.
97.6%of wristband claimers took part in networking
3,353beacon taps across the experience
523recorded session check-ins
The McLendon Experience 2026 · Event highlights93 seconds · Sound available in player
The experience at a glance
People used more than one part of the system.
Networking reached 166 of 170 wristband claimers. Beacon exploration reached 143, and session check-ins reached 132. Different ways to participate gave attendees different ways into the experience.
Share of 170 wristband claimers
Wristband networking97.6%
Profiles with links85.3%
Beacon exploration84.1%
Session check-ins77.6%
App installation task completed62.9%
Push notifications enabled55%
Session participation challenges40%
People can appear in more than one category, so percentages should not be added together. Profile links, installation task completion and push settings reflect the report snapshot.
01 / Before arrival
The experience started before check-in.
The branded event hub gave people a place to get started before they arrived. Pre-event onboarding and quest activity were already being recorded through September 29.
109pre-event account signups
653pre-event task completions
Those early actions included 16 quest completions and 552,000 points awarded, giving the event a measurable lead-in.
September 1–29, 2026. Pre-event figures cover all included hub accounts, independently of the event wristband cohort.
The event in your pocket · Explore the app
YOUR EVENT•••
Your quests.Explore the event
Complete three tasks to unlock your reward.
Your progress2 of 3
Visit a sponsor
Make a connection
03Find a beaconUP NEXT
QUEST REWARD+300 points
A wristband linked to a person
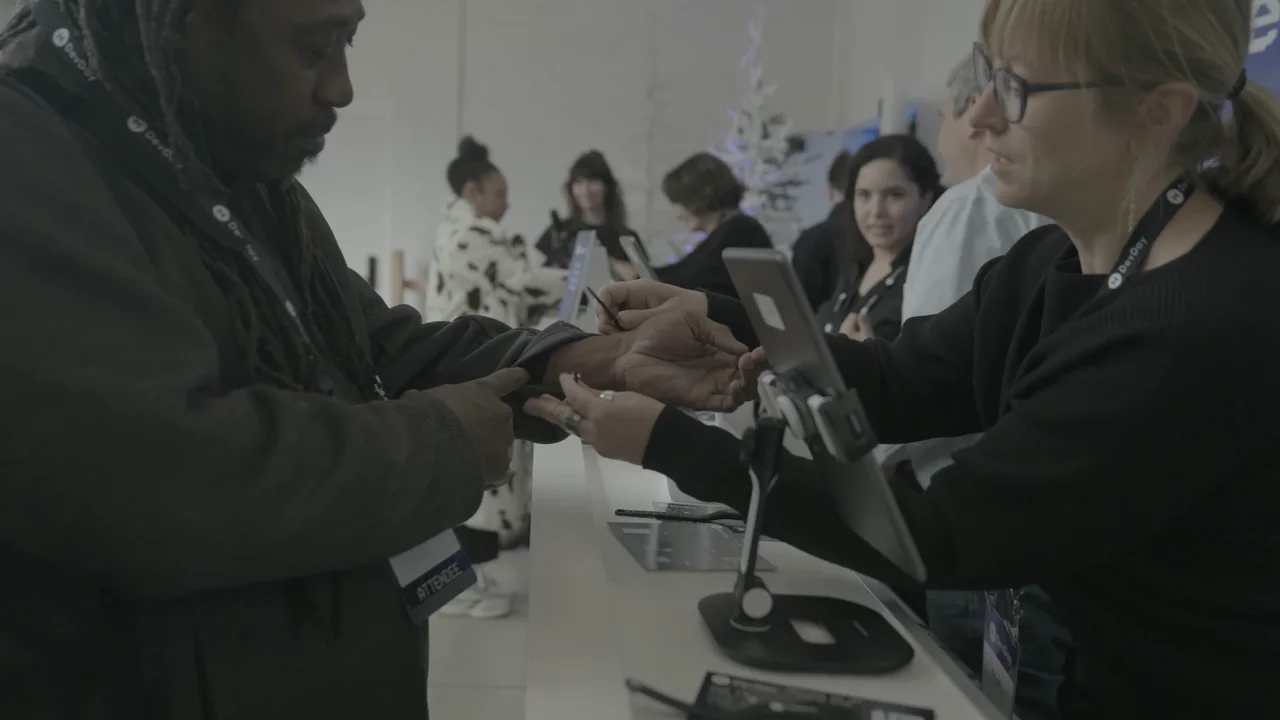
170 people claimed a connected wristband. The physical credential became an entry point to their profile and recorded activity.
An app that stayed close
107 wristband claimers completed the installation task. Onboarding also introduced push notifications and location access.
A way to stay in touch
Feed posts and push notifications gave the organizer a way to share updates. 94 wristband claimers had push enabled in the report snapshot.
An introduction starts with a tap
02 / Wristband networking
Make an introduction, then keep the connection.
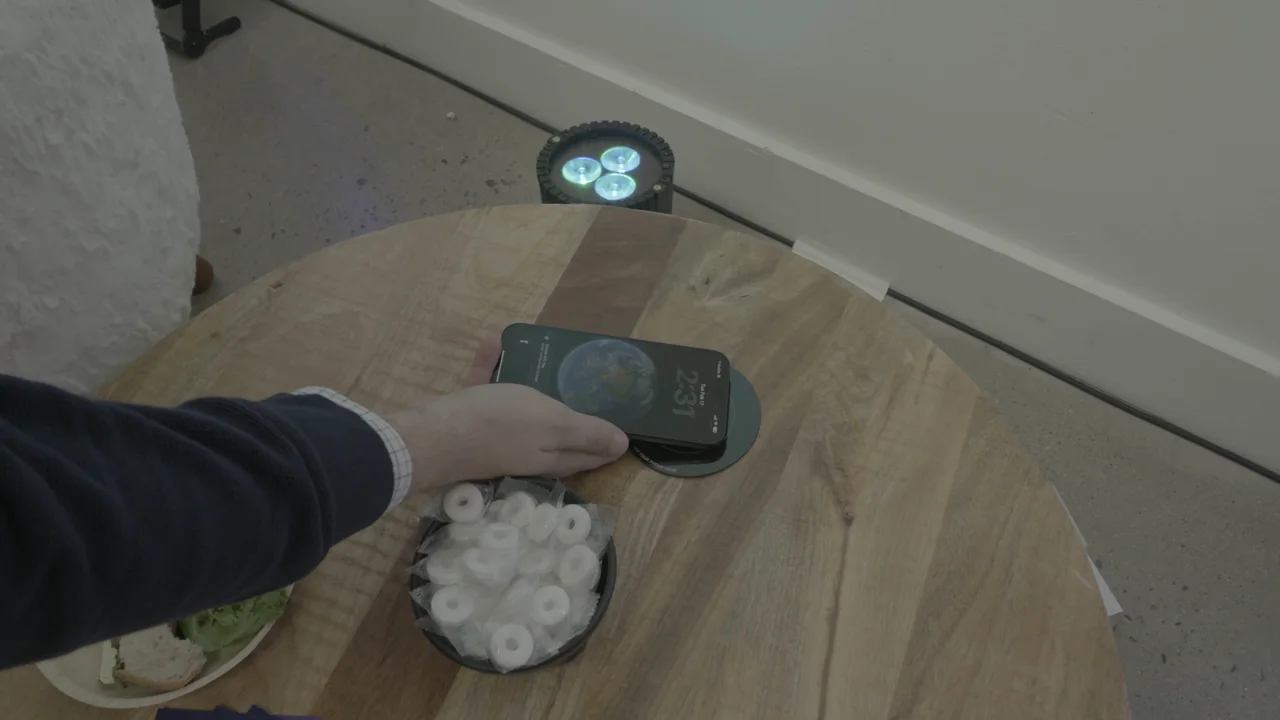
A phone tap on a connected wristband brought up a profile. Attendees could introduce themselves, exchange details and work toward networking milestones, with a separate “Return the Favor” quest encouraging connections in the other direction.
97.6%networking participation
2,504recorded networking connections
166 of 170 wristband claimers took part, a 97.6% participation rate. At the reporting snapshot, 145 had profiles with links, giving those introductions somewhere useful to lead.
Connections are recorded interactions and can include repeat or one-way connections. They are not a count of unique relationships.
03 / Discovery & partner touchpoints
Give people a reason to look around.
Beacons connected physical discovery to progress in the app. Attendees found and tapped their way through the experience, with exploration quests and partner touchpoints adding more reasons to move beyond the next session.
3,353beacon taps by 143 wristband claimers
84.1% of wristband claimers explored with beacons. The report recorded 2,684 distinct person-and-beacon combinations across 94 tapped beacons.
A reason to explore
Discovery built into the venue
Physical beacons gave attendees something to find and an immediate action to take in the app.
Measurable partner touchpoints
312 partner-beacon taps were recorded across the wider hub. This separate total is for beacons given to sponsors of the McLendon Experience, which attendees were driven to engage with.
A final round of exploration
42 wristband claimers completed 147 tasks in “The Final Stretch,” a special challenge we delivered exclusively by push notification in the final hours of the event.
Take part in the programming
04 / Sessions & participation
Make taking part visible.
Session codes let attendees record their check-ins in the app. Alongside them, participation challenges recognized contributions during sessions, while secret-code tasks added another way to engage.
77.6%of wristband claimers checked into sessions
523 session check-ins from 132 wristband claimers. Each check-in connected a person to a linked session in the event report.
05 / Trivia, content & feedback
Keep the purpose of the event in the experience.
Trivia brought McLendon history and the foundation’s work into the app. A video quest offered another way to learn about John McLendon, while social challenges and feedback invited attendees to add their own perspective.
890trivia answers completed by 54 people
Learning became another path to progress alongside networking and exploration.
23 long form testimonials gave the organizer another view of the experience alongside the recorded activity.
Learn through play · Trivia and video quests
Points for networking and quest completions added up fast
LIVE RANKINGSLeaderboard
01Player 011,240PTS
02Player 021,120PTS
03Player 03980PTS
06 / Quests, points & competition
Let each action contribute to something bigger.
Quests connected individual tasks to larger goals. Points and XP recognized participation, while the leaderboard made progress visible across the event.
4.96Mpoints awarded during the event reporting period
Wristband claimers recorded 2,347 task completions and 167 quest completions. There were 25 winners of exciting prizes McLendon provided for the attendees!
From the experience to the evidence
The organizer could see how the pieces were used.
The report brought networking, beacon discovery, sessions, quests and content into one view. It showed which mechanics reached the widest audience and where people went deeper.
For a future event, those results give the team a starting point: retain the networking experience that reached almost every wristband claimer, build on broad exploration and session participation, and use the smaller challenges to offer more ways in.
Snapshot of a partial dashboard overview
Event Partner case study · Passive RFID
Solana Summit Canada
Event Partner · September 23–24, 2026 · Toronto
Understanding the event as people moved through it.
At St. Lawrence Market North, Solana Summit Canada connected wristband registration, passive RFID tracking and active swag claims. Attendees registered a wristband, moved around the conference and tapped to claim swag. Readers at the entrance and stage boundaries recorded observations without asking people to tap at every crossing.
Totals include pre-registration on September 22 and the event on September 23–24, with tracking from 07:00–22:00 Toronto time each day.
86%of people detected by RFID reached the stage area
2,163zone crossings tracked across the entrance and stage
33,833passive RFID observations recorded
Solana Summit Canada · Event highlights60 seconds · Sound available in player
Registration
A wristband connected the visit.
A total of 548 people registered for wristbands, with 587 wristbands assigned, including pre-registration and both event days. Linking a wristband to an attendee connected their movement around the venue with their active swag claims.
The additional wristband associations reflect replacements for lost or damaged bands, keeping each attendee’s activity connected when a replacement was needed.
Pre-registration on September 22 accounted for 71 wristbands registered to 70 people, giving the group a head start before the event opened.
Wristband registration12 seconds · Silent montage
Stage reach
Most people detected by RFID reached the stage area.
86%365 of 423 people detected by RFID
RFID detections at the stage were linked to 365 people across pre-registration and the event. That gives the organizer a clear measure of stage reach among people detected by RFID.
Programming and movement around the stage formed part of the event picture.
Returning on day two
People came back for more.
59%of people detected by RFID on day one returned on day two
129 people returned on September 24 after being detected by RFID on September 23. Across pre-registration and both event days, RFID readers detected 463 wristbands, with detections linked to 423 people.
33,833 passive RFID observations supported a detailed picture of movement, including 2,163 zone crossings: 807 at the entrance and 1,356 at the stage. Observations include repeat detections as wristbands moved through reader coverage.
The venue in motion12 seconds · Silent montage
People detected by RFID each day
September 22 · Pre-registration32
September 23220
September 24325
RFID detections linked to 423 people across pre-registration and the event, including 129 who returned on the second event day.
From wristband tap to swag12 seconds · Silent montage
Active participation
A tap turned a wristband into swag.
372distinct people claimed swag
The staffed redemption tablet recorded 372 items claimed by 372 people: 203 on September 23 and 169 on September 24.
Each claim was an intentional action. Keeping it separate from passive reader observations gives the organizer a clear record of reward fulfilment alongside movement through the venue.
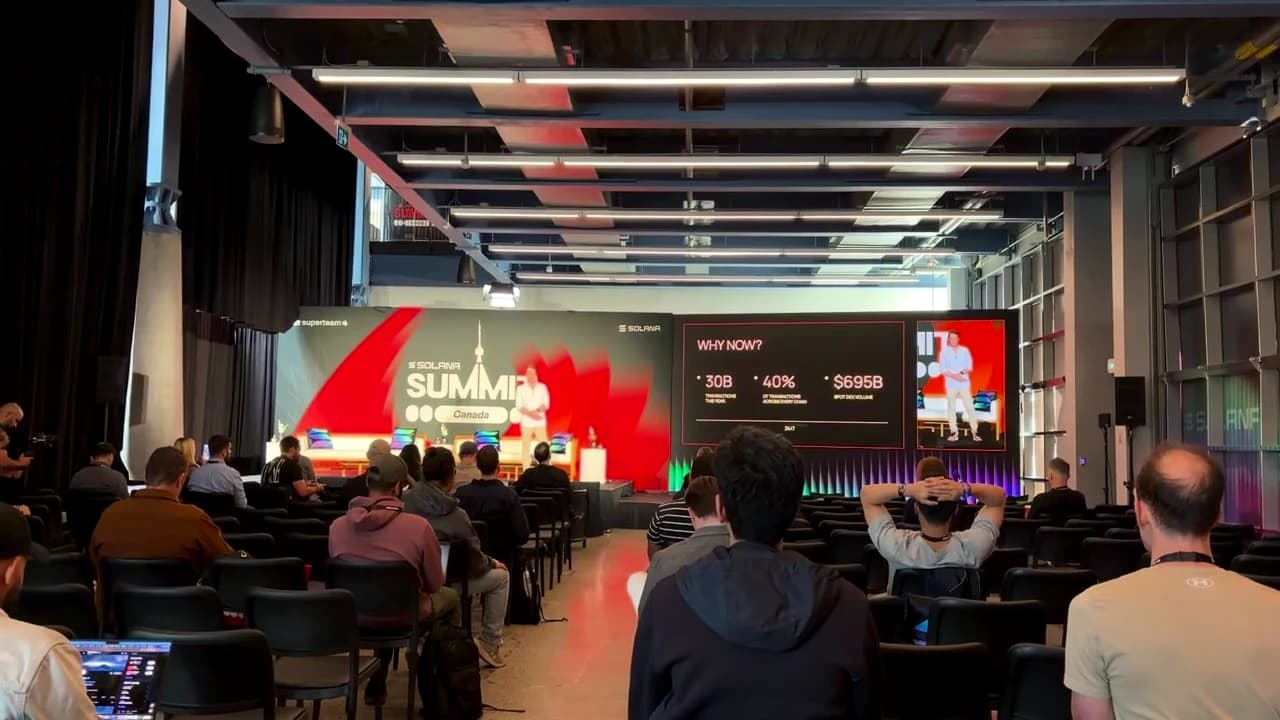
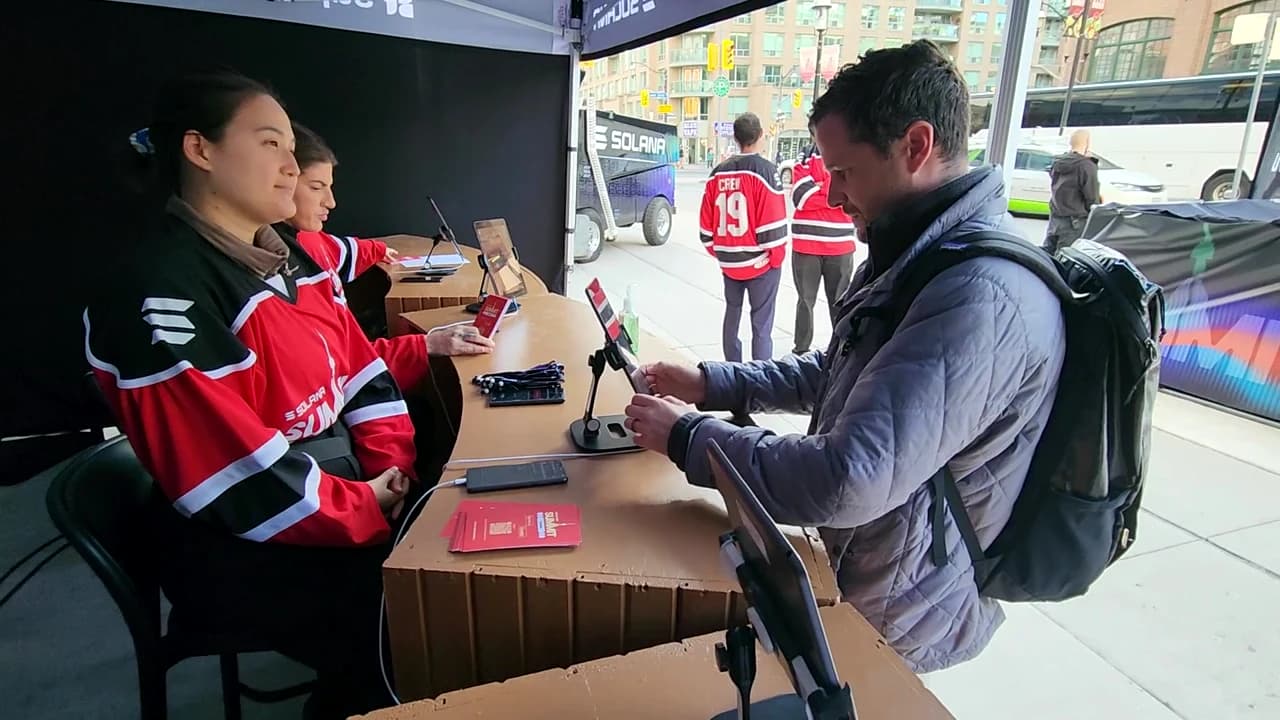
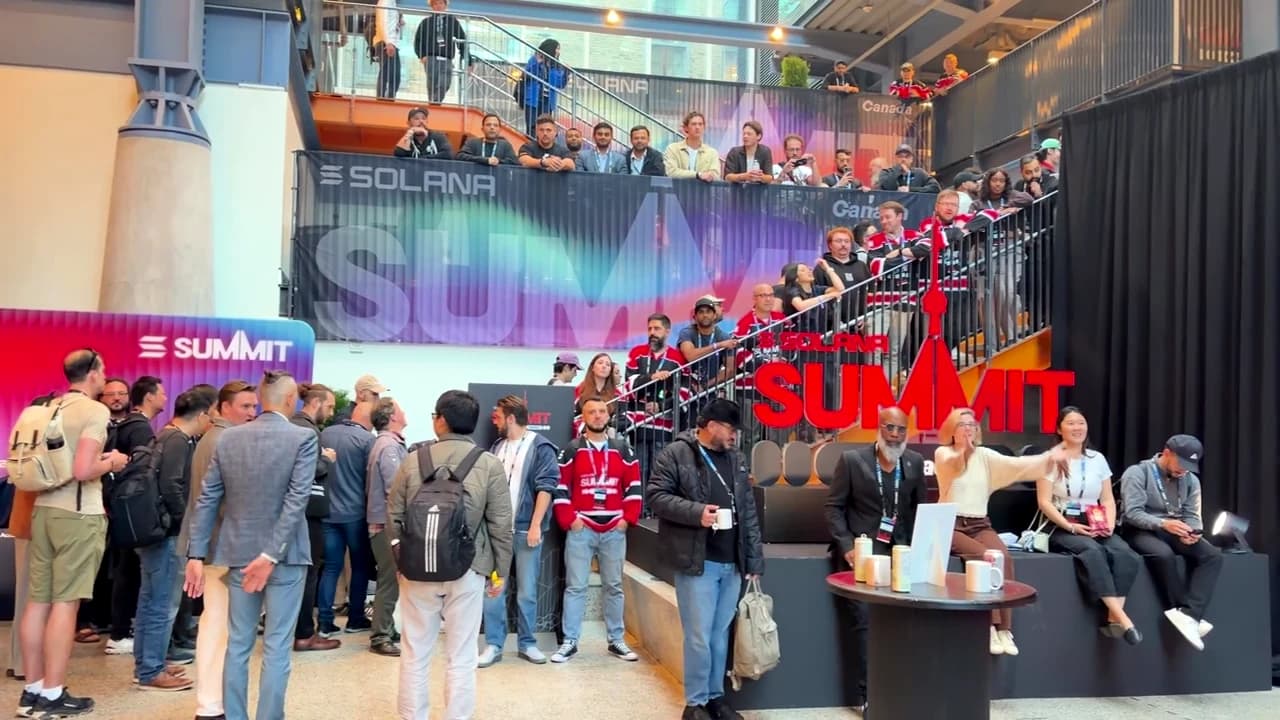
The registration team helped attendees connect their wristbands.The Solana Summit Canada community gathered across two days in Toronto.
From insight to decision
What we’d recommend next
The deployment connected two kinds of evidence: where wristbands were observed and what people actively did. Each answers a different operational question.
Compare the programme with observed movement
Use stage-area reach and the timing of observations to identify sessions or transitions worth investigating. Pair that evidence with the programme before drawing conclusions about content.
Plan for people coming back
Use the returning audience to plan registration staffing, re-entry and communications for the second day.
Keep rewards measurable
Retain the deliberate redemption step so stock and fulfilment can be reconciled against claim records, independently of how often a wristband passes a reader.
Brand Partner case study
Hedera DevDay
Brand Partner · February 17, 2026 · Denver
Connecting developers to more of the Hedera ecosystem.
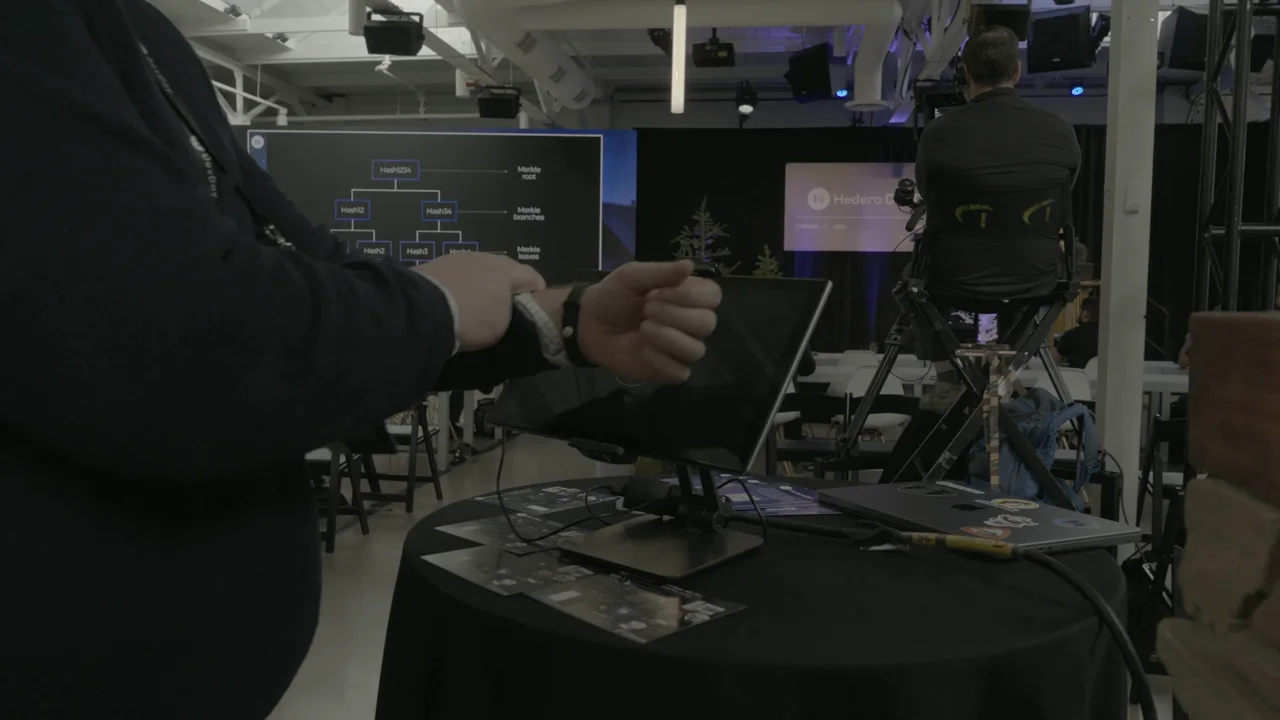
At Hedera DevDay, Intrface helped developers explore ecosystem stations, take part in educational programming, meet one another and compete for high-value rewards. Connected wristbands brought those experiences together, turning participation across the day into behavioral data the Hedera team could use.
Hedera DevDay · Event highlights24 seconds · Sound available in player
The activation
A reason to explore, learn and connect.
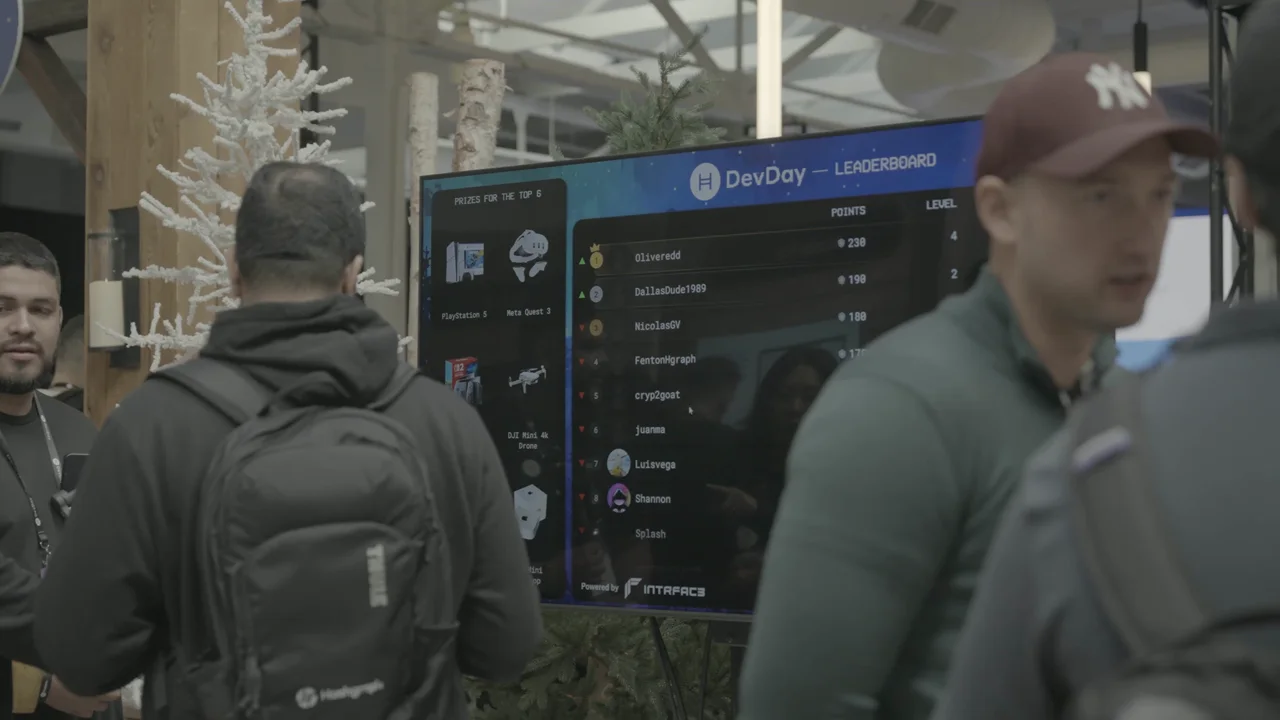
Attendees used their wristbands and phones to make connections, check into stations and sessions, and complete quests. Points accumulated on a live leaderboard, with six premium prizes, including a PS5 and a drone, giving developers something to work toward.
Connected wristbands
Peer-to-peer networking
Session check-ins
Ecosystem stations
Quests, leaderboard and rewards
A connected wristband brought each attendee into the experience.
From arrival to participation
Almost everyone who joined went on to participate.
74%of all DevDay attendees became active Intrface participants
Of the 133 people at DevDay, 100 created a profile and 99 recorded activity. That is 99% activation among created profiles, showing that joining the experience usually led to taking part.
133Attendees
100Profiles
99Active participants
Quest depth · Share of active participants
At least 1 task89%
3+ tasks56%
5+ tasks45%
10+ tasks26%
20+ tasks11%
807 quest tasks were completed, roughly 8.2 per active participant. Participation extended well beyond the first interaction, with more than a quarter completing at least ten tasks.
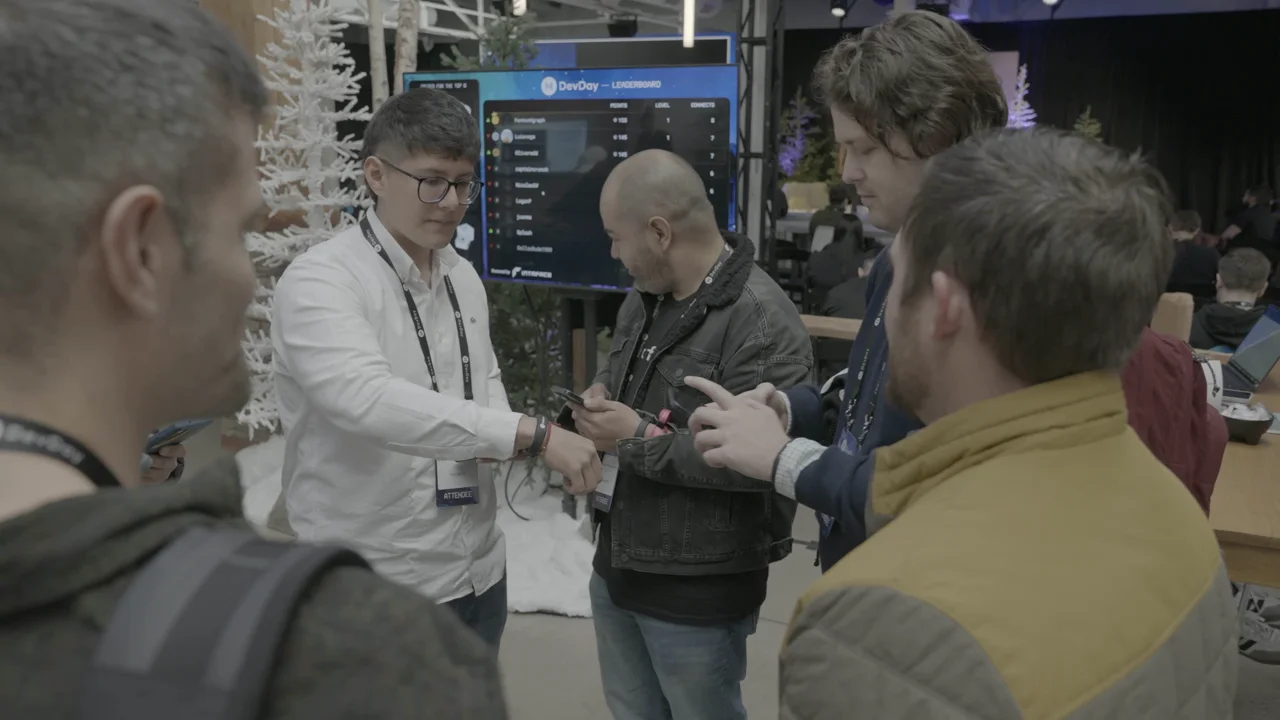
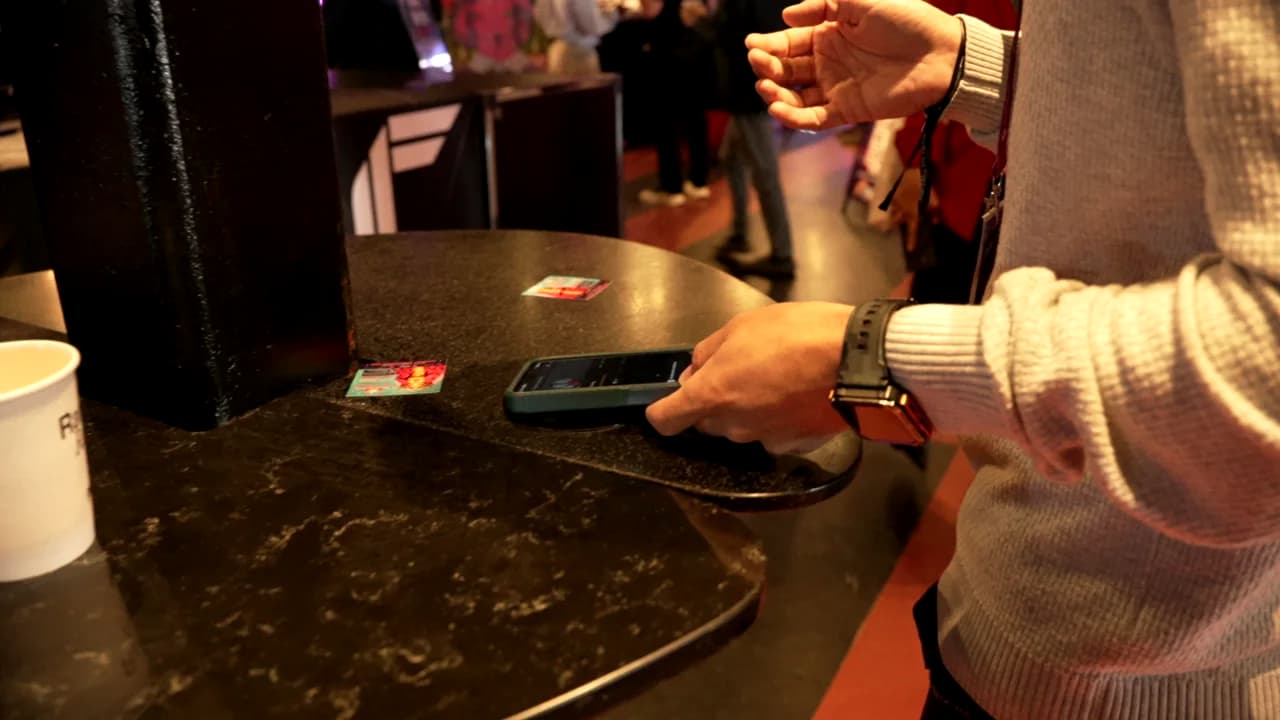
Developers exchanged connections using their phones and wristbands.
Networking
Making introductions part of the experience.
68%of active participants took part in tracked peer-to-peer networking
Those who networked averaged 8.3 recorded connections, and five attendees recorded 20 or more. Hedera could see how extensively developers used the networking experience, a behavior that would usually disappear into the room.
“It took the awkwardness out of networking. Because everyone was participating, people had a natural reason to connect.”
Feedback from Hedera DevDay attendees
Educational programming
A second signal beyond entering the room.
40% of active participants checked into at least one tracked session. Among those who checked in, the average was 3.28 sessions, while 30% of active participants recorded two or more.
Secret codes embedded in talks and workshops added another signal: 24% of users responded to content delivered during live programming. Hedera could distinguish a session check-in from an active response to its content.
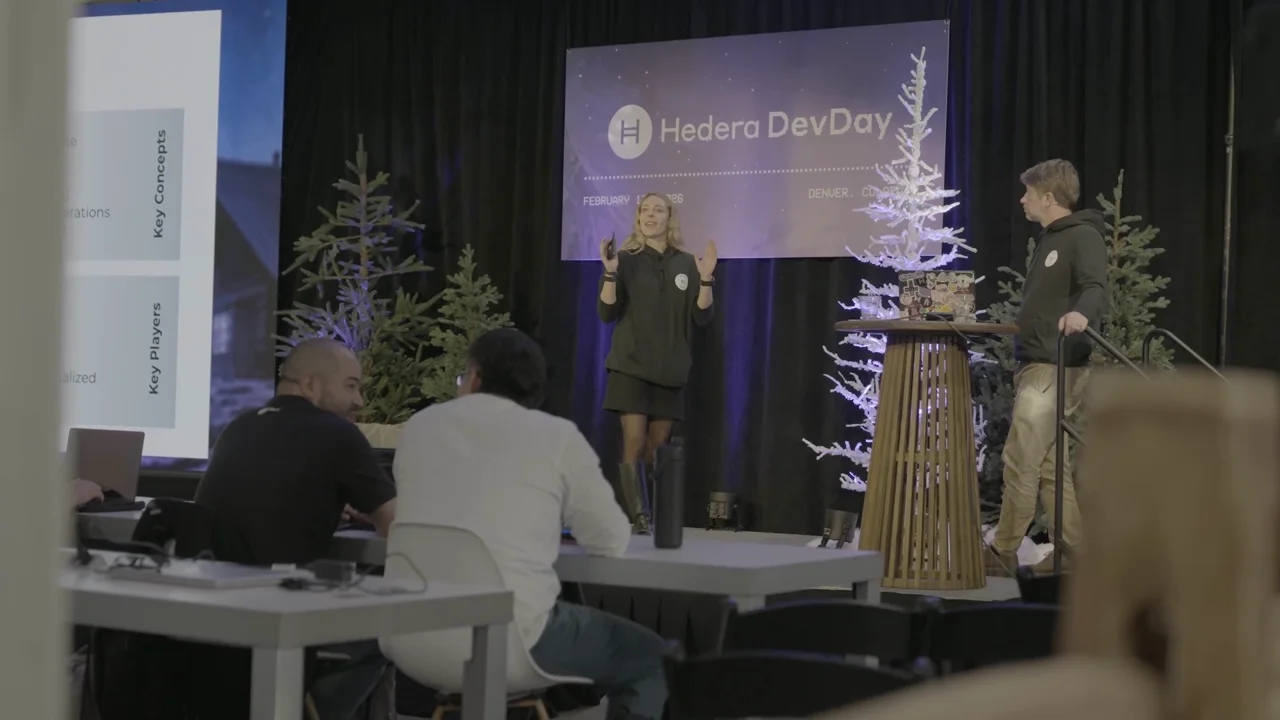
Session check-ins and live codes recorded different parts of educational participation.
Explore stations · Recorded check-ins
Swag Station58
Typing Game36
Hello Hiero33
Hedera Experts31
Hedera Studios30
Developer Tooling29
Cap-The-Flag26
AI Agents25
Ecosystem exploration
Reward-linked destinations stood out.
61%more check-ins at the Swag Station than the next-highest station
Eight stations generated 268 check-ins. Swag accounted for 58, compared with 36 at the next station, making up 21.6% of station activity.
That difference gives Hedera a concrete direction to test: connect rewards or progression milestones to ecosystem partners and educational areas that deserve more attention.
Discoveries gave developers a reason to explore beyond their first destination.The live leaderboard made participation and competition visible throughout DevDay.
Beyond the event floor
An audience Hedera could reach again.
42%of participants became push-addressable during DevDay
With push notifications enabled, this segment could receive relevant follow-up after the event. A further permission signal, 48% enabling location, showed how participants opted into the experience.
Hedera left with a way to continue the developer relationship through technical resources, ecosystem updates and future event invitations.
What the data revealed
A clearer view of what to build on.
Networking resonated.More than two-thirds of active participants used it, with repeated connections among those who took part.
Rewards and power users shaped participation.The Swag Station led exploration, while 11% of active participants completed at least 20 quest tasks.
Engagement changed across the day.Quest activity reached its highest hourly count at noon, with 155 completions. Session check-ins and live codes gave the team separate signals to compare with the program.
From insight to decision
What we’d recommend next
The next event can build on the behaviors developers already chose, while making participation easier and rewards attainable for more people.
Expand incentivized networking
Keep networking central to DevDay. With 68% of active participants taking part, additional connection milestones and small challenges could help more developers find a reason to introduce themselves.
Broaden the reward structure
Retain premium prizes for the most active competitors, then add achievable milestones and reward tiers for people in the middle of the leaderboard. The goal is to give more attendees a reason to keep going.
Use rewards to guide exploration
The Swag Station attracted 61% more check-ins than the next station. Test reward-linked milestones at important ecosystem partners, educational areas and destinations that need more traffic.
Continue the relationship after DevDay
Use the push-addressable audience for relevant developer resources, ecosystem updates, future invitations and new quests. DevDay can become the beginning of an ongoing community relationship.
Recognize the most active developers
Explore ambassador opportunities, early access and targeted follow-up for the power users revealed through quests, networking and programming.
Event Partner case study
Blockchain Futurist
Event Partner · July 21–22, 2026 · Toronto
Turning an entire conference into something attendees could explore.
Across two days at Blockchain Futurist, Intrface connected venue exploration, sponsor booths, programming, trivia, social challenges and rewards into one participation system. A 100-beacon scavenger hunt, session codes and a public leaderboard gave attendees reasons to discover more of the conference, while showing the event team how people participated.
Blockchain Futurist · Event highlights24 seconds · Sound available in player
The activation
One journey across the conference.
Physical touchpoints brought sponsor and booth engagement into the same experience as programming, trivia and verified social activity. Every completed challenge contributed to shared points and progression, with a staffed reward station closing the loop.
Venue-wide discovery
Sponsor touchpoints
Secret session codes
Trivia
X, Instagram and LinkedIn challenges
Leaderboard and prize redemption
73%of onboarded profiles completed at least one activity
276Profiles created
201Task participants
Participation
Joining led to repeated activity.
Of the 276 profiles created, 201 people completed an activity. Across those participants, 4,727 recorded actions amounted to roughly 23.5 actions per participating user.
The experience gave attendees reasons to return throughout the conference, whether they were exploring the floor, following the program or working toward their next reward.
Movement across the venue
Physical discovery drove the experience.
65%of recorded activity came from booth interaction and scavenger exploration
1,925 booth interactions and 1,164 scavenger finds produced 3,089 physical discovery interactions. Most recorded engagement was connected to exploring the conference and its partners.
A physical discovery point connected the conference floor to the next challenge.
When the floor was active
An hour worth planning around.
On Day 1 between 11 AM and noon, the system recorded 213 booth interactions and 103 scavenger finds: 316 physical interactions in one hour.
That gives the organizer a useful window to compare with breaks, announcements and incentives when planning sponsor activations, staffing and discovery prompts.
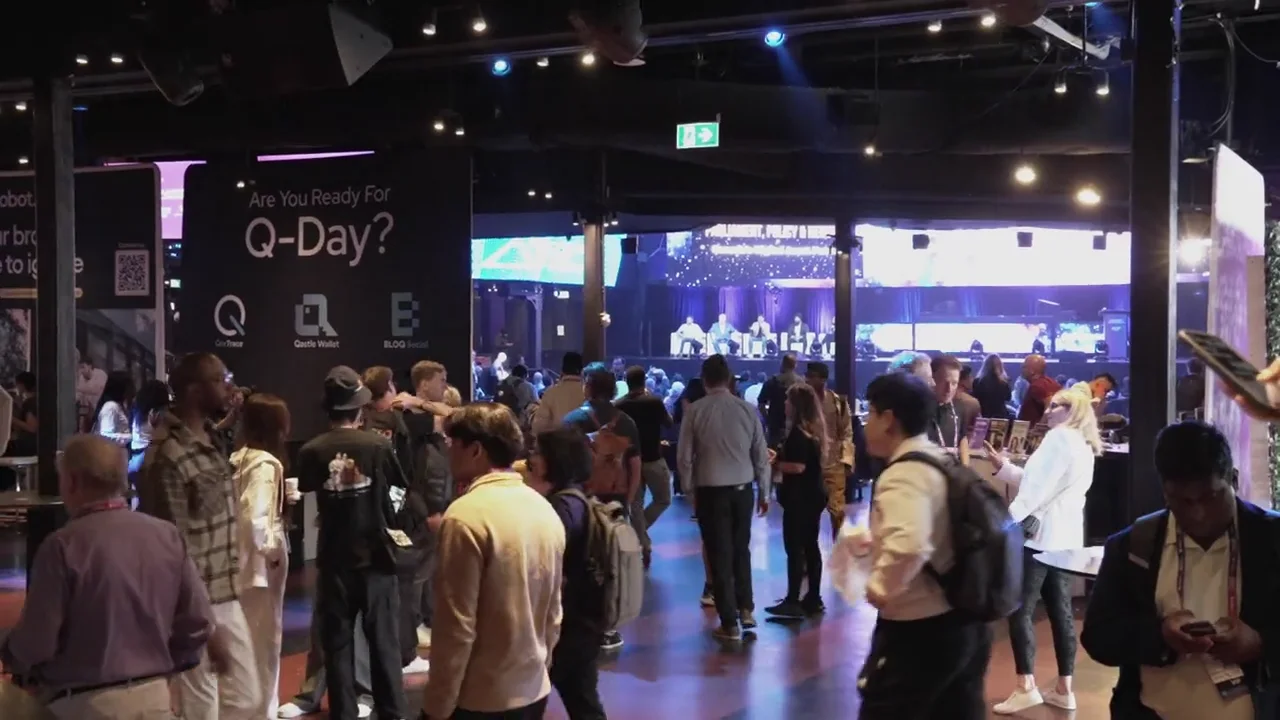
The activity data gave the Futurist team a view across the event.
Sponsor performance
Sponsor engagement varied across the floor.
Two anonymous placements · Tracked interactions
Placement A63
Placement B4
A 63-interaction placement recorded almost 16 times the activity of a four-interaction placement. Other lower-performing placements recorded only four to nine interactions.
That range points to practical questions about location, visibility, signage and incentives before the next floor plan is set.
Programming
Main Stage held most of the tracked attention.
78%of recorded programming interactions came from Main Stage
Secret codes embedded in programming recorded 798 completions across 123 tasks. Main Stage generated 619 of those completions, despite representing about 43% of available tracked programming tasks.
Code completions show an active response to content. Comparing that response across formats, locations and time slots gives the team a more useful starting point than attendance alone.
Programming tracks · Verified code completions
Main stage619
Upper stage52
ETHToronto50
Side events37
ETHWomen35
Bootcamp5
Compare completions per programming task
Average code completions per available task
Main Stage11.7
ETHToronto4.5
ETHWomen2.9
Upper Stage2.5
Side Events2.2
Bootcamp0.6
Day 2 programming · Code completions by hour
1–2 PM80
2–3 PM87
3–4 PM78
4–5 PM14
From programming to decisions
The next schedule can start with evidence.
On Day 2, programming activity concentrated between 1 PM and 4 PM, with 80, 87 and 78 completions in successive hours. The following hour recorded 14.
Individual sessions also varied: the strongest generated around 20–27 code completions, while several workshops and side events recorded zero. Those results flag formats, locations or time slots to investigate before the next conference.
Futurist can test better promotion, different scheduling and routes from Main Stage into secondary programming, then compare the next event with this baseline.
Connected participation
Attendees moved between different parts of Futurist.
135 people participated in both booth exploration and the scavenger hunt. Programming also overlapped with booths for 58 people and scavenger exploration for 57, showing how activities reached across the same audience.
Booths135 shared with scavenger
Scavenger57 shared with programming
Programming34 shared with trivia
Trivia20 shared with social
Social30 shared with booths
92% of trivia participants also explored the physical event. Of 37 trivia players, 34 participated in booth exploration, and 34 in the scavenger hunt. Trivia generated 669 answers, roughly 18 per player, showing considerable depth within a smaller audience.
Social challenges generated 70 verified posts: 25 on X, 24 on Instagram and 21 on LinkedIn. Seventeen participants completed all three platforms, contributing 51 posts, or 73% of the verified social activity.
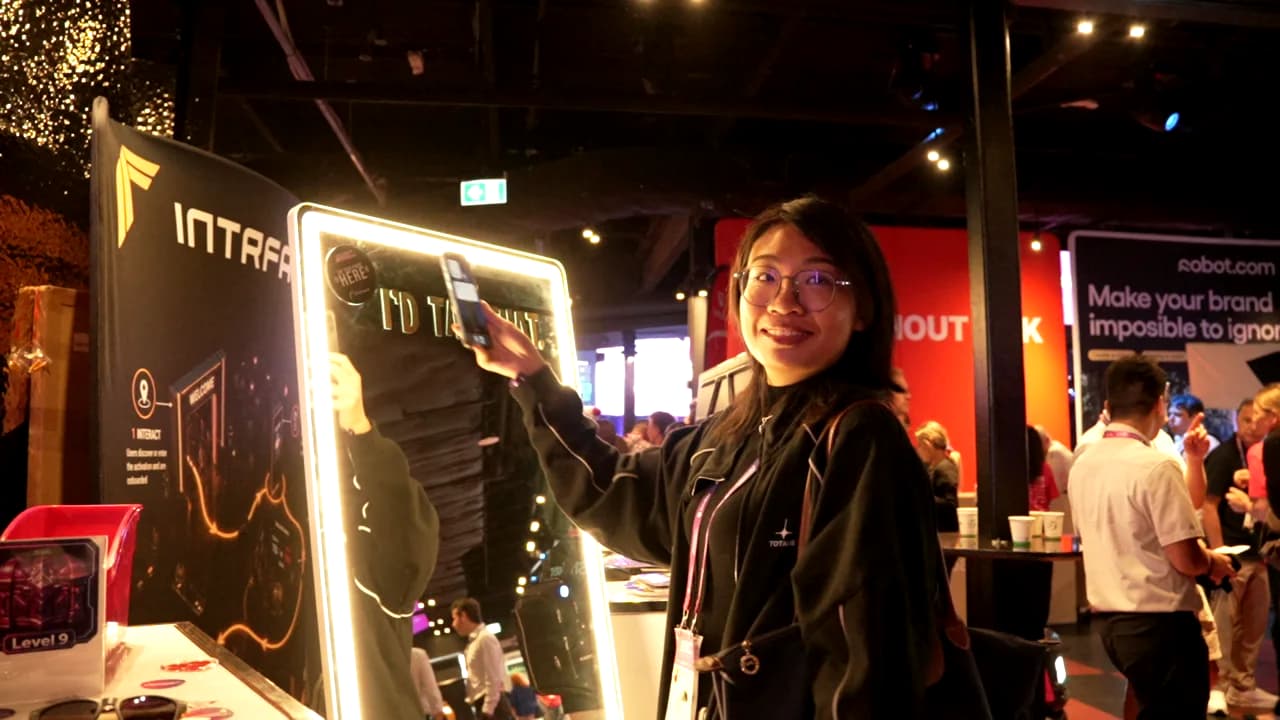
The selfie mirror gave attendees a social moment within the event experience.Attendees compared their progress around the live leaderboard.
Competition
Enough to keep the most committed players exploring.
153activities completed by the top participant
First place earned 77,400 points, followed by 144 activities and 74,500 points in second place. The top ten held roughly 26% of the 2.565 million points issued, alongside a broader field of 201 task participants.
The leaderboard made deep participation visible while the wider experience gave casual and mid-depth users ways to take part.
“Literally the most fun I've had a conference in years!”
DaRock33, 1st place leaderboard winner at Blockchain Futurist
DaRock33, first-place leaderboard winner at Blockchain Futurist.
An attendee shows a reward collected at the Intrface booth.
Rewards
Participation reached the reward station.
94tracked prize claims across eight claimed reward tiers
Attendees could turn their progress into a physical reward through Intrface’s tracked redemption system. The booth gave them a place to check points, collect prizes and share the experience with the team.
Participate
Earn
Compete
Redeem
What the data revealed
A more useful picture of the conference.
Futurist could see where physical exploration was strongest, how sponsor engagement varied and which programming drew active responses. Timing and crossover data connected those observations to the wider attendee journey.
The floor drove most recorded activity.Booths and scavenger discoveries made up nearly two-thirds of actions.
Programming deserved a closer look.Main Stage dominated code completions, and the Day 2 afternoon window stood out.
Digital activities reached physical participants.Trivia players also explored the floor, while competition and reward tiers supported different depths of participation.
From insight to decision
What we’d recommend next
Use the strongest routes and programming moments to help more attendees discover the conference, while investigating the places where measured participation was lower.
Route discovery toward the places that need it
Build on the 135-person crossover between booths and the scavenger hunt. Place future challenges at lower-traffic sponsors, new venue areas and strategically important partners.
Investigate sponsor placement performance
Compare booth location, visibility, signage, incentives and nearby programming before changing the floor plan. A single-digit result is a useful prompt to investigate the whole activation.
Protect the strongest programming window
Day 2 activity concentrated between 1 PM and 4 PM. Test flagship sessions, important sponsor moments and major announcements in that window, alongside the schedule and room context.
Help attendees discover secondary programming
Use a Main Stage interaction to unlock a related challenge elsewhere. For tracks with lower recorded participation, test timing, promotion, location, format and competing sessions before deciding what to change.
Add a credential layer
Connect attendee exploration to programming, trivia, rewards and social challenges through a physical, connected ID credential. The overall participation would have multiplied with a more seamless experience.
Keep competition visible and milestones achievable
Keep the public leaderboard's energy while retaining multiple reward tiers. Casual participants should have attainable goals alongside the competitors completing more than 100 activities.
Bring behavioral evidence into sponsor conversations
Report booth interactions, traffic timing and crossover with event activities. Use the evidence to explain what attendees did with an activation and improve the next sponsor package.
From data to decisions
Better visibility leads to better decisions.
Strong results show what to build on, while quiet areas and unexpected patterns show where to investigate. Together, they help shape a better next event.
Understand what happened
Connect participation to the places, programming and incentives behind it, then identify the questions the next event should answer.
Work through what comes next
The Intrface team works alongside you through planning, deployment, live execution and reporting, with practical recommendations that turn the findings into a next step.